
Bitcoin falls below $70,000 for the first time since August 20
CoinGecko's hourly data shows a slide of about 6.9% in 24 hours. A sentiment index fell to its lowest reading since July, Cointelegraph reported.
Update (November 14, 2026, 10:21 UTC): Added Bitcoin's further fall to an hourly low of $66,691 on November 14, the October producer price index, Chicago Fed President Austan Goolsbee's comment, and complete ETF flow figures for Thursday, Friday and the week; replaced the preliminary Thursday figure and updated the points to watch.
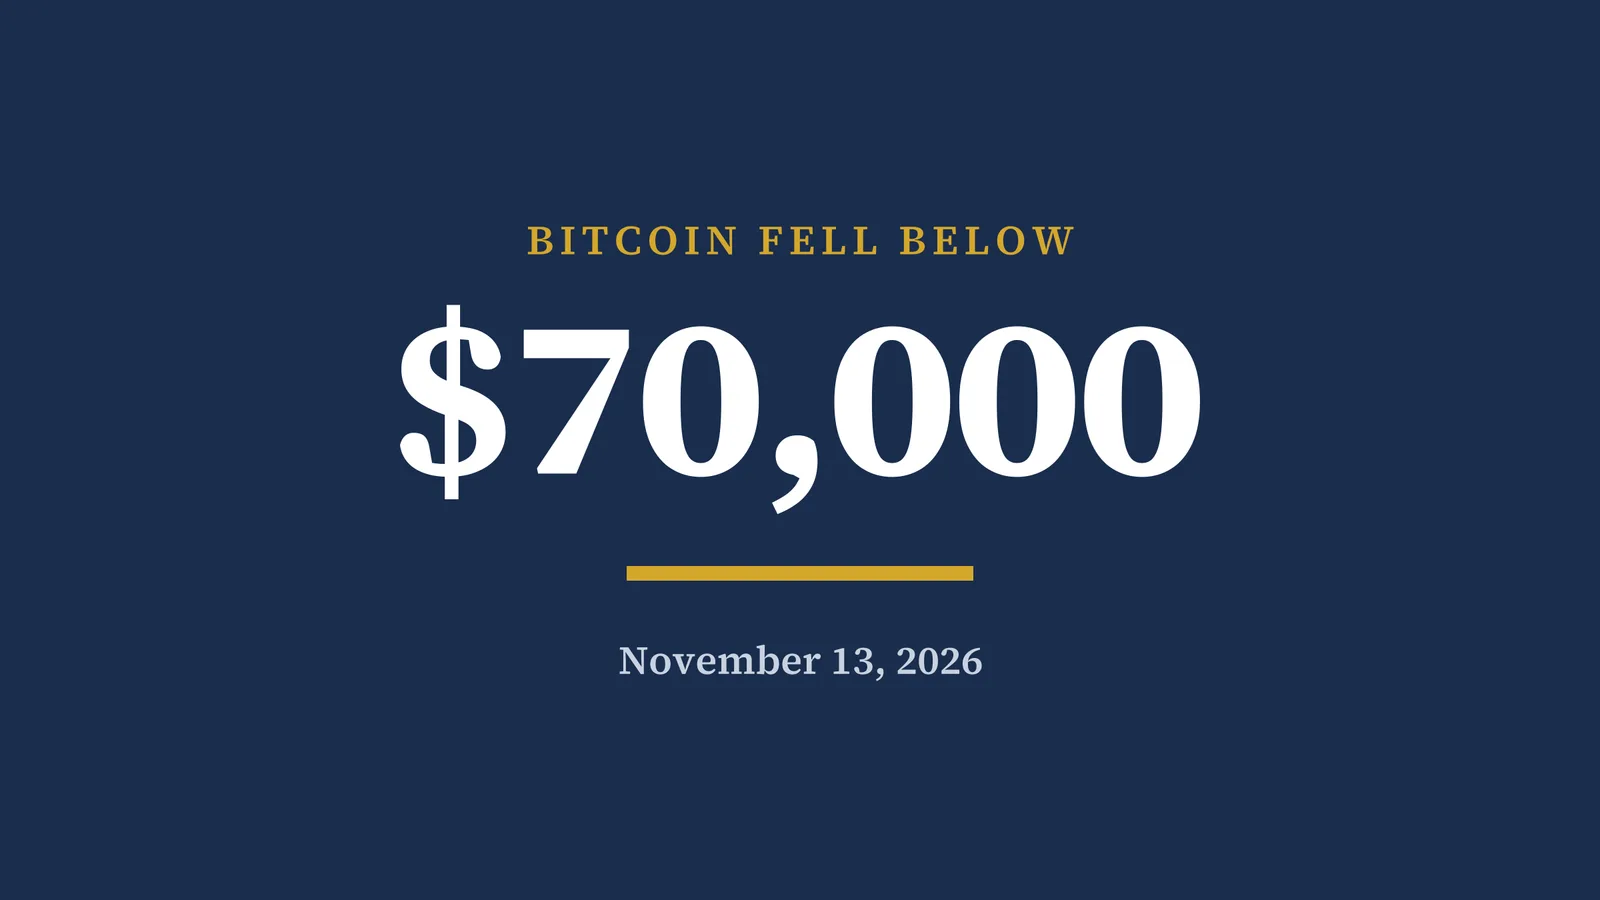
Bitcoin fell below $70,000 early on Friday, November 13, 2026, for the first time since August 20, a day after it dropped under $72,000. The price was about $68,430 at 06:19 UTC, according to CoinGecko.
Update, November 14: Bitcoin near $67,000
Bitcoin kept falling after this article was first published. CoinGecko's hourly data shows a low of $66,691 at 04:00 UTC on Saturday, November 14. The last lower hourly reading was $65,888 on August 19. At 09:56 UTC the price was about $67,401, about 2.4% lower than 24 hours earlier, according to CoinGecko.
The US producer price index, published at 13:30 UTC on Friday, showed that producer prices rose 0.3% in October and 6.5% from a year earlier, the largest 12-month rise since November 2022, according to the Bureau of Labor Statistics. Chicago Fed President Austan Goolsbee told CNBC the same day that inflation is "going the wrong way" (our report on his comments).
US spot Bitcoin ETFs had net outflows of $1.07 billion in the week of November 9–13, after $1.28 billion in the week of November 2–6, and BlackRock's IBIT has now had 11 sessions of net outflows in a row, Cointelegraph reported, citing Farside Investors data.
What happened to the Bitcoin price
Bitcoin held near $71,400 through Thursday evening, UTC time, and then slid during Asian trading hours. The hourly reading went from $70,887 at 02:00 UTC to $70,188 at 03:00 UTC and $68,891 at 04:00 UTC, CoinGecko's data shows. The last hourly reading below $70,000 before that was $69,760 on August 20.
The 06:19 UTC price compares with about $73,520 at 06:00 UTC on Thursday and about $75,617 at 06:00 UTC on November 6, the nearest hourly readings, which gives the declines of about 6.9% and 9.5%.
What analysts told Cointelegraph
Cointelegraph reported that Vikram Subburaj, chief executive of the crypto exchange Giottus, attributed the weakness to institutional outflows, tighter liquidity in crypto markets and expectations that the Federal Reserve will raise interest rates in December. Fed Governor Christopher Waller said on November 10 that he was leaning toward a December increase.
The research firm 10x Research said Bitcoin had fallen 5.9% between November 5 and November 12 while the Nasdaq 100 gained 6.4%, and that Bitcoin was moving with Treasury yields and the dollar more than with technology shares, according to the report. The trading technology company Talos said the depth of Bitcoin order books on major exchanges was about a third below normal on November 9, which can make price moves larger in both directions, Cointelegraph reported.
These are the views of the people quoted. Markets do not publish reasons for price moves.
ETF flows
BlackRock's iShares Bitcoin Trust (IBIT) had more than $2 billion of net outflows over nine sessions in a row through Wednesday, and US spot Bitcoin exchange-traded funds (ETFs) as a group lost nearly $1.44 billion over five sessions, Cointelegraph reported. The daily figures in the TFTC flow tracker add up to the same totals. Our earlier article covered the fund outflows through November 10. Thursday's first figure of $47.7 million, which Cointelegraph took from Farside Investors data, did not yet include the BlackRock and Fidelity funds; the complete figure for the day was $284.1 million of net outflows, Cointelegraph reported on November 14.
What it could mean for traders
In our assessment, the fall through $70,000 extends a decline that has now run for more than a week without a single cause that can be shown. The points to watch are measurable ones: daily ETF flows and the Federal Reserve's December 8–9 meeting, for which the October producer price data, published on Friday, added to evidence of rising inflation. Thin order books cut both ways, and a sharp move in either direction would not by itself show a change in trend.
Sources
- US Bureau of Labor Statistics — Schedule of Releases for the Producer Price Index
- US Bureau of Labor Statistics — Producer Price Indexes — October 2026 (USDL 26-1687) (November 13, 2026)
- Cointelegraph — Bitcoin slides below $70K amid thin liquidity, ETF outflows (November 13, 2026)
- Cointelegraph — Bitcoin ETFs Lose $2.35B as BlackRock Outflows Hit 11 Sessions (November 14, 2026)
- CNBC — Chicago Fed's Goolsbee says central bank 'has definitely got work to do' on inflation (November 13, 2026)
- CoinGecko — Bitcoin price (market_chart API, hourly, 90 days, read at 06:19 UTC and again with data through 06:23 UTC on November 13, 2026)
- TFTC — Bitcoin ETF flows, November 2026 (flow tracker, data updated November 11, 2026)
- TFTC — Bitcoin ETF flows, October 2026 (flow tracker)
- Alternative.me — Crypto Fear & Greed Index
- CoinGecko — Bitcoin price (market_chart API, hourly, read at about 10:00 UTC on November 14, 2026)
This article was researched and drafted with the help of AI tools, checked against its sources in a separate AI fact-check and edit, and approved for publication by Trading Metrics. Read our AI use policy.
This article is for information only and is not financial advice. Crypto assets and leveraged products are volatile and you can lose money. Do your own research and consider your circumstances before trading.