
Bitcoin closes a week below its 200-week average after a 12.7% drop, and Strategy shares fall under $100
Bitcoin ended the week of November 9 about 4% under the long-term average, by our calculation from Binance data. Strategy closed at $96.50 on November 17, its first close below $100 since August.
Contents
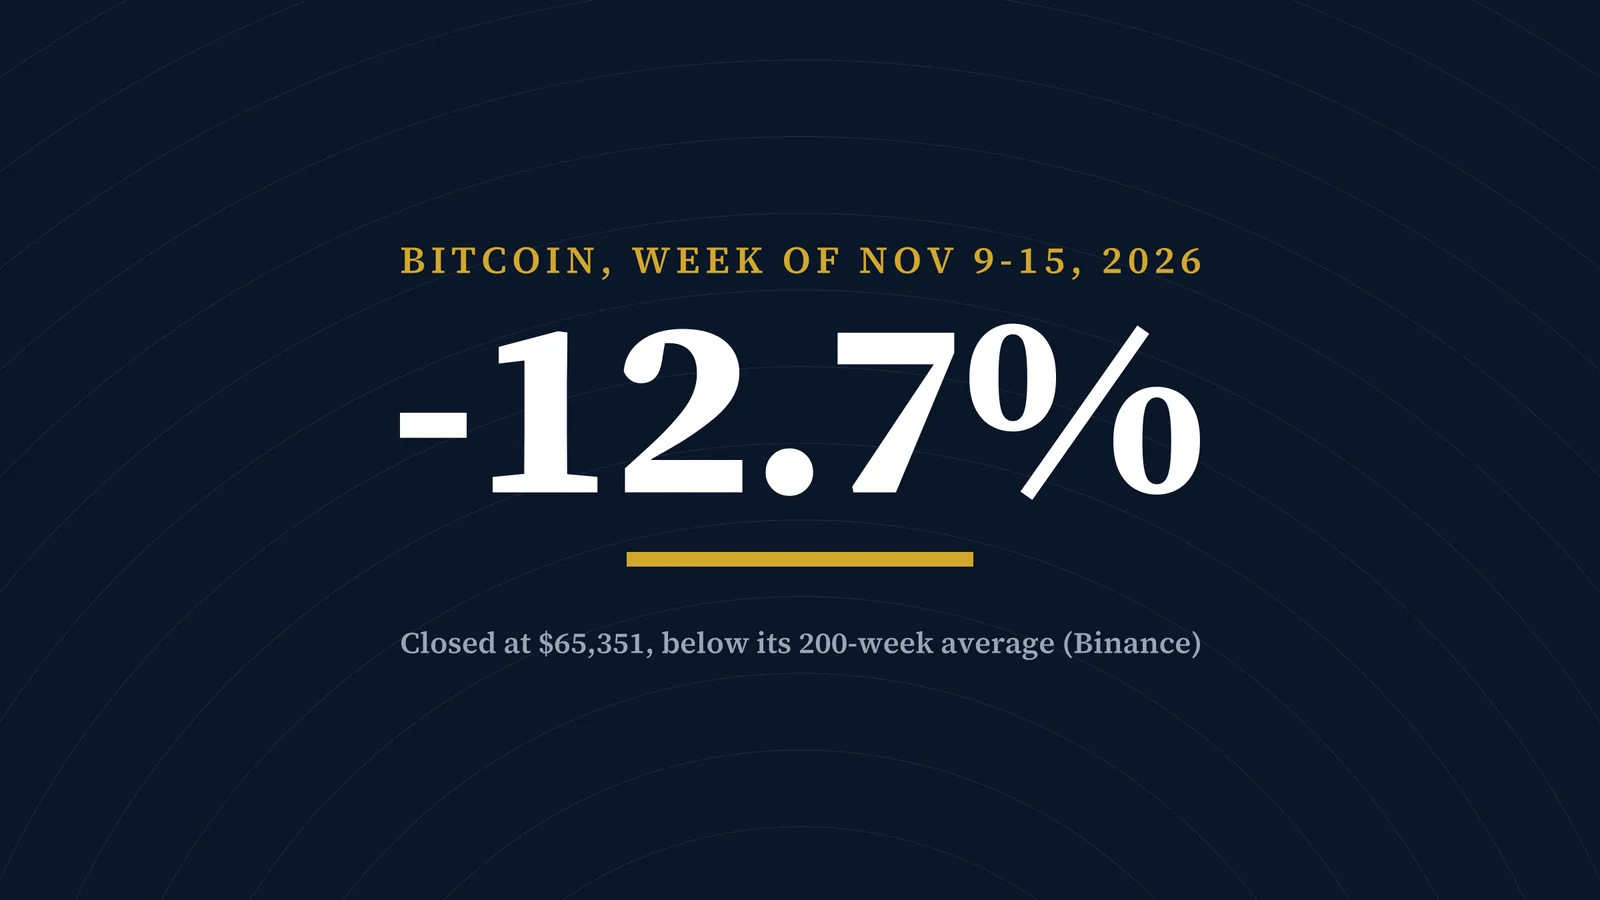
Bitcoin (BTC) fell 12.7% in the week from November 9 to 15, 2026, and closed the week at $65,351, below its 200-week simple moving average of about $67,983, according to our calculation from Binance's BTC/USDT market data. Two days later, on Tuesday, November 17, shares of Strategy (MSTR) closed at $96.50, their first close below $100 since August, Yahoo Finance data show.
How the 200-week average was broken
The 200-week simple moving average is the plain average of the last 200 weekly closing prices, a span of almost four years. Traders use it as a gauge of Bitcoin's long-term trend.
We computed it from Binance's weekly BTC/USDT candles, which run from Monday 00:00 UTC to Sunday 23:59 UTC. For the week ending November 15, the average of the 200 completed weekly closes from the week of January 16, 2023, through the week of November 9, 2026, was $67,983. A week earlier it was $67,760. Bitcoin opened the week of November 9 at $74,851, about 10% above the average, and closed at $65,351, about 3.9% below it. Its low for the week was $62,006 on Sunday, November 15.
Other data sources give slightly different figures, because exchanges and price indexes differ. CoinDesk, using TradingView data, put the weekly drop at 12.6% and the average near $68,000.
By the same Binance calculation, this is the third weekly close below the 200-week average in 2026. Bitcoin also closed below it in the weeks of June 22 and August 10, and closed back above it the following week both times. Neither of those weeks fell more than 6%.
Strategy closes under $100
Strategy fell 6.3% on Tuesday, from $103.03 to $96.50, according to Yahoo Finance data. Its last close below $100 was $92.52 on August 18, 2026. The stock has lost about 20% since its close of $121.07 on November 10.
The common stock also closed below Strategy's STRC preferred stock, which ended Tuesday at $98.70. Bitcoin Magazine reported on Tuesday that it was the first time the common had traded below the preferred since mid-August. Bitcoin Magazine says on its site that it is published by BTC Inc., a subsidiary of Nakamoto Inc.
Strategy held 850,849 BTC as of November 15, bought at an average price of $75,452 including fees, according to its Form 8-K filed with the US Securities and Exchange Commission on November 16. In the week to November 15 it bought 485 BTC and spent $228.1 million on STRC buybacks, the filing shows. At about $64,750, Bitcoin was about 14% below that average cost, by our calculation, which values the holdings at about $55.1 billion against a total purchase price of $64.2 billion.
Bitcoin Magazine said the stock fell as crypto-linked shares and the broader US market declined while traders waited for Nvidia's quarterly results. It put Bitcoin's low on Tuesday at about $63,300; Binance's daily data show a low of $63,336.
What earlier breaks looked like
CoinDesk's analysis by Omkar Godbole, published at 04:34 UTC on November 18, counted three earlier weekly drops of 12% or more since 2013 that also took Bitcoin below its 200-week average: in August 2015, March 2020 and June 2022. In each case, Bitcoin first fell a further 10% to 17%, and three months after the break it was higher, by 40.3%, 82.5% and 6.3% respectively, CoinDesk reported. The gain after the 2022 break did not last: the collapse of FTX later that year sent Bitcoin to about $15,500.
CoinDesk itself called three cases a small sample and said exchange-traded fund (ETF) outflows and rising bond yields could keep prices under pressure for longer. A day earlier, CoinDesk had reported that market maker Wintermute warned Bitcoin could slide into the $50,000s after losing the average. Three historical cases are not a statistical basis for expecting any outcome, and past patterns do not predict future prices.
Other signs of strain had built up around the weekly close. BlackRock's spot Bitcoin ETF, IBIT, had outflows of $2.35 billion before it ended an 11-session outflow streak on November 16. On Deribit, the $60,000 put had become the largest options bet, and stablecoin supply fell 5.3% in 30 days, its steepest decline since mid-2022.
What to watch next
Bitcoin went from about 10% above its 200-week average to about 4% below it in a single week. The two earlier closes below the average in 2026 were each reversed the next week, while in the historical cases CoinDesk cites Bitcoin first fell further before any recovery; neither pattern settles what comes next. For Strategy, the gap between Bitcoin's price and the company's $75,452 average cost, and whether its common stock stays below the STRC preferred, are figures that its weekly 8-K filings and daily trading will show. The next weekly close on Binance comes at 23:59 UTC on Sunday, November 22.
Sources
- SEC EDGAR — Strategy Inc, Form 8-K of November 16, 2026 (November 16, 2026)
- CoinDesk — Bitcoin's 12% slide through key support looks scary, but history says give it 3 months (November 18, 2026)
- Bitcoin Magazine — Bitcoin price slips below $64,000 as Strategy (MSTR) falls below $100 (November 17, 2026)
- Binance — BTC/USDT weekly and daily candles (public market data API) (November 18, 2026)
- Yahoo Finance — MSTR and STRC daily price data (November 18, 2026)
This article was researched and drafted with the help of AI tools, checked against its sources in a separate AI fact-check and edit, and approved for publication by Trading Metrics. Read our AI use policy.
This article is educational and not financial advice. Trading derivatives and leveraged products carries a high risk of losing money quickly, and losses can exceed deposits on some platforms. Only trade with money you can afford to lose.