
Bitcoin slides to its lowest level since August as spot ETF outflows top $1.2 billion
Bitcoin fell to about $73,980 and ether to about $2,120 late on November 8, according to CoinGecko data. US spot Bitcoin ETFs saw about $1.28 billion in net outflows in the week to November 6.
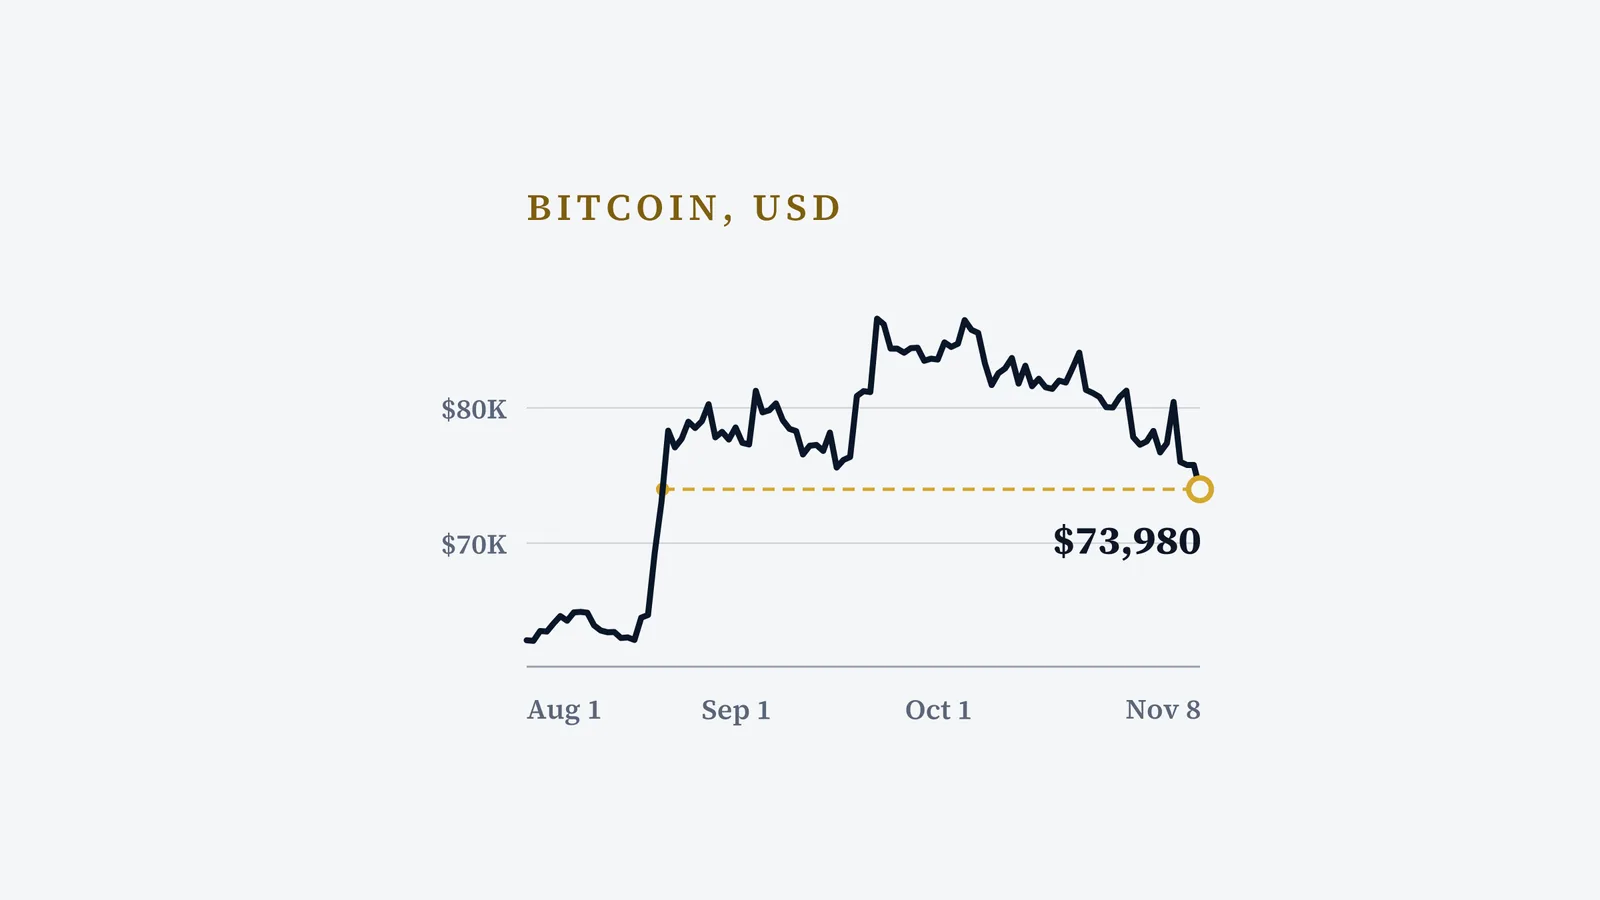
Bitcoin fell to about $73,980 at 22:00 UTC on Sunday, November 8, its lowest level since August, and ether dropped from about $2,225 at 21:00 UTC to about $2,122 an hour later, according to CoinGecko hourly data. The decline followed a week of heavy outflows from US spot Bitcoin exchange-traded funds.
How prices moved
The slide built over the week. At 7:15 a.m. ET (12:15 UTC) on Friday, November 6, BTC traded at $76,023.87, down $4,197.53 from a day earlier, according to Fortune. That was roughly 25% below its level a year earlier. Ether was at $2,239.51 at the same time. Later that day, Bitcoin's low of $74,762 was its lowest since August 21, Bitcoin.com News reported.
By 22:00 UTC on Sunday, Bitcoin was at about $73,980, and it was at about $73,830 at 08:00 UTC on Monday, November 9, according to CoinGecko. CoinGecko figures are hourly aggregates, so intrahour lows can be deeper.
ETF outflows
US spot Bitcoin ETFs recorded about $1.28 billion in net outflows between November 2 and 6, according to SoSoValue data cited by Analytics Insight; the TFTC flow tracker shows the same totals. BlackRock's iShares Bitcoin Trust (IBIT) accounted for about $1.21 billion, including about $403 million on Friday alone, when total outflows across the funds reached $411.9 million. Wednesday, November 4, was the only day with a net inflow, of $74.6 million.
Liquidations of leveraged positions reached about $1.04 billion over 24 hours, according to CoinGlass data cited by Analytics Insight, which did not say which 24-hour period it measured.
What drove the week
Several events landed in quick succession:
- The Binance hack on October 29, after which Bitcoin fell below $77,000, CoinDesk reported.
- The US midterm elections on November 3, in which Democrats won control of Congress, according to media projections. Bitcoin rebounded to just above $80,000 on November 4, Decrypt reported, before resuming its decline.
- The October jobs report on November 6, which showed payrolls up 165,000, the BLS said, nine days after two Fed officials dissented in favor of a rate increase.
No single cause explains the move. In our assessment, the timing of the outflows alongside these events is consistent with investors reducing risk.
What it could mean for traders
ETF flows are a visible measure of institutional demand: sustained outflows remove a source of buying. Liquidations show how much leverage was cleared out during the drop. The next markers are the October CPI report, scheduled for November 10 at 13:30 UTC, daily ETF flow data, and whether Bitcoin holds above its early-November lows.
Sources
- US Bureau of Labor Statistics — The Employment Situation — October 2026 (USDL-26-1632) (November 6, 2026)
- US Bureau of Labor Statistics — Consumer Price Index release schedule
- CoinGecko — Bitcoin and Ethereum prices (USD), hourly data
- Fortune — Current price of Bitcoin for November 6, 2026 (November 6, 2026)
- Decrypt via Yahoo Finance — Bitcoin Rebounds After Democratic Midterm Sweep, But Crypto Faces Tougher Fight in Washington (November 4, 2026)
- CoinDesk — Binance loses over $6 billion in 'biggest crypto hack in history' (October 29, 2026)
- Bitcoin.com News — Bitcoin price falls below $75K for first time since August as tech sell-off deepens (November 6, 2026)
- TFTC — Bitcoin ETF Flows, November 2026
- Analytics Insight — Bitcoin Falls to USD 73,708, Ethereum Hits Two-Month Low After US Midterm Elections (November 9, 2026)
This article was researched and drafted with the help of AI tools, checked against its sources in a separate AI fact-check and edit, and approved for publication by Trading Metrics. Read our AI use policy.
This article is for information only and is not financial advice. Crypto assets and leveraged products are volatile and you can lose money. Do your own research and consider your circumstances before trading.