
Bitcoin falls to about $62,000, its lowest level since July
CoinGecko's data shows the price about 15% lower than a week earlier. The Crypto Fear & Greed Index fell to 10, deep in "extreme fear," as the selloff spread across the crypto market.
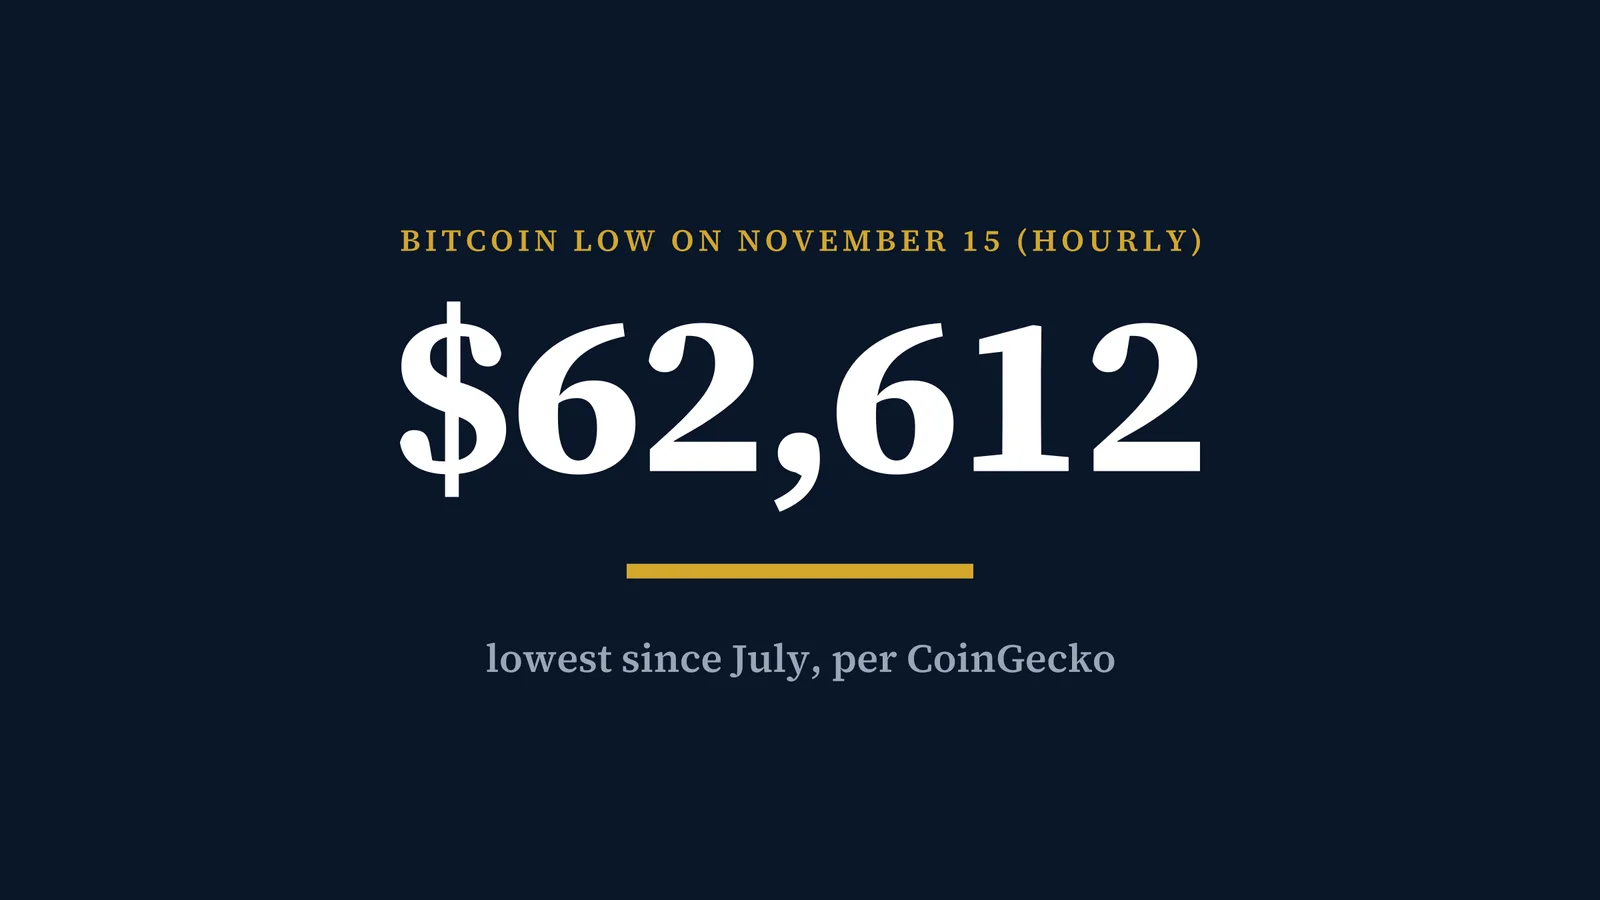
Bitcoin (BTC) fell to about $62,000 on Sunday, November 15, its lowest level since July, before recovering part of the drop. Cointelegraph reported a 24-hour low of $62,080.91, citing CoinGecko. CoinGecko's hourly data shows a low of $62,612 at 02:00 UTC and a price of about $64,586 at 16:49 UTC.
How far Bitcoin has fallen
Bitcoin fell below $70,000 on November 13 for the first time since August and kept sliding over the weekend. The intraday low that Cointelegraph took from CoinGecko, $62,080.91, falls between CoinGecko's hourly readings, which is why the hourly low is higher.
Other large cryptocurrencies fell further. Ether (ETH) lost 19.5% and Solana (SOL) 20.7% over the past week, Cointelegraph reported on Sunday, citing CoinGecko.
Sentiment and fund flows
The Crypto Fear & Greed Index, which Alternative.me compiles for Bitcoin from volatility, market momentum and volume, social media, Bitcoin's market dominance and search trends, read 10 on November 15, in its "extreme fear" band. It was 13 on November 14 and 20 on November 13.
US spot Bitcoin exchange-traded funds had net outflows of $1.07 billion in the week of November 9–13, after $1.28 billion the week before, Cointelegraph reported on November 14, citing Farside Investors data.
The backdrop
The slide came during a week of signs that inflation is speeding up. US producer prices rose 6.5% from a year earlier in October, the most since 2022, and Chicago Fed President Austan Goolsbee told CNBC on November 13 that inflation is "going the wrong way." Futures markets fully priced a Federal Reserve rate increase at the December 8–9 meeting, CNBC reported the same day, citing CME Group's FedWatch tool.
On the network itself, Bitcoin's mining difficulty fell 9.13% on November 14, after blocks arrived more slowly than the 10-minute target over the previous two weeks.
What it could mean for traders
In our assessment, the drop to about $62,000 extends a decline that has run through November, alongside fund outflows and fears of higher interest rates. The points to watch are measurable ones: daily ETF flows, the Fed's December meeting and whether the price holds above the November 15 low. Sentiment readings near 10 describe how traders feel; they do not predict where the price goes next.
Sources
- Cointelegraph — Bitcoin falls to four-month low near $62K as crypto selloff deepens (November 15, 2026)
- Cointelegraph — Bitcoin ETFs Lose $2.35B as BlackRock Outflows Hit 11 Sessions (November 14, 2026)
- CNBC — Chicago Fed's Goolsbee says central bank 'has definitely got work to do' on inflation (November 13, 2026)
- CoinGecko — Bitcoin price (market_chart API, hourly and daily, read at about 16:50 UTC on November 15, 2026)
- Alternative.me — Crypto Fear & Greed Index
This article was researched and drafted with the help of AI tools, checked against its sources in a separate AI fact-check and edit, and approved for publication by Trading Metrics. Read our AI use policy.
This article is for information only and is not financial advice. Crypto assets and leveraged products are volatile and you can lose money. Do your own research and consider your circumstances before trading.